Impressionist
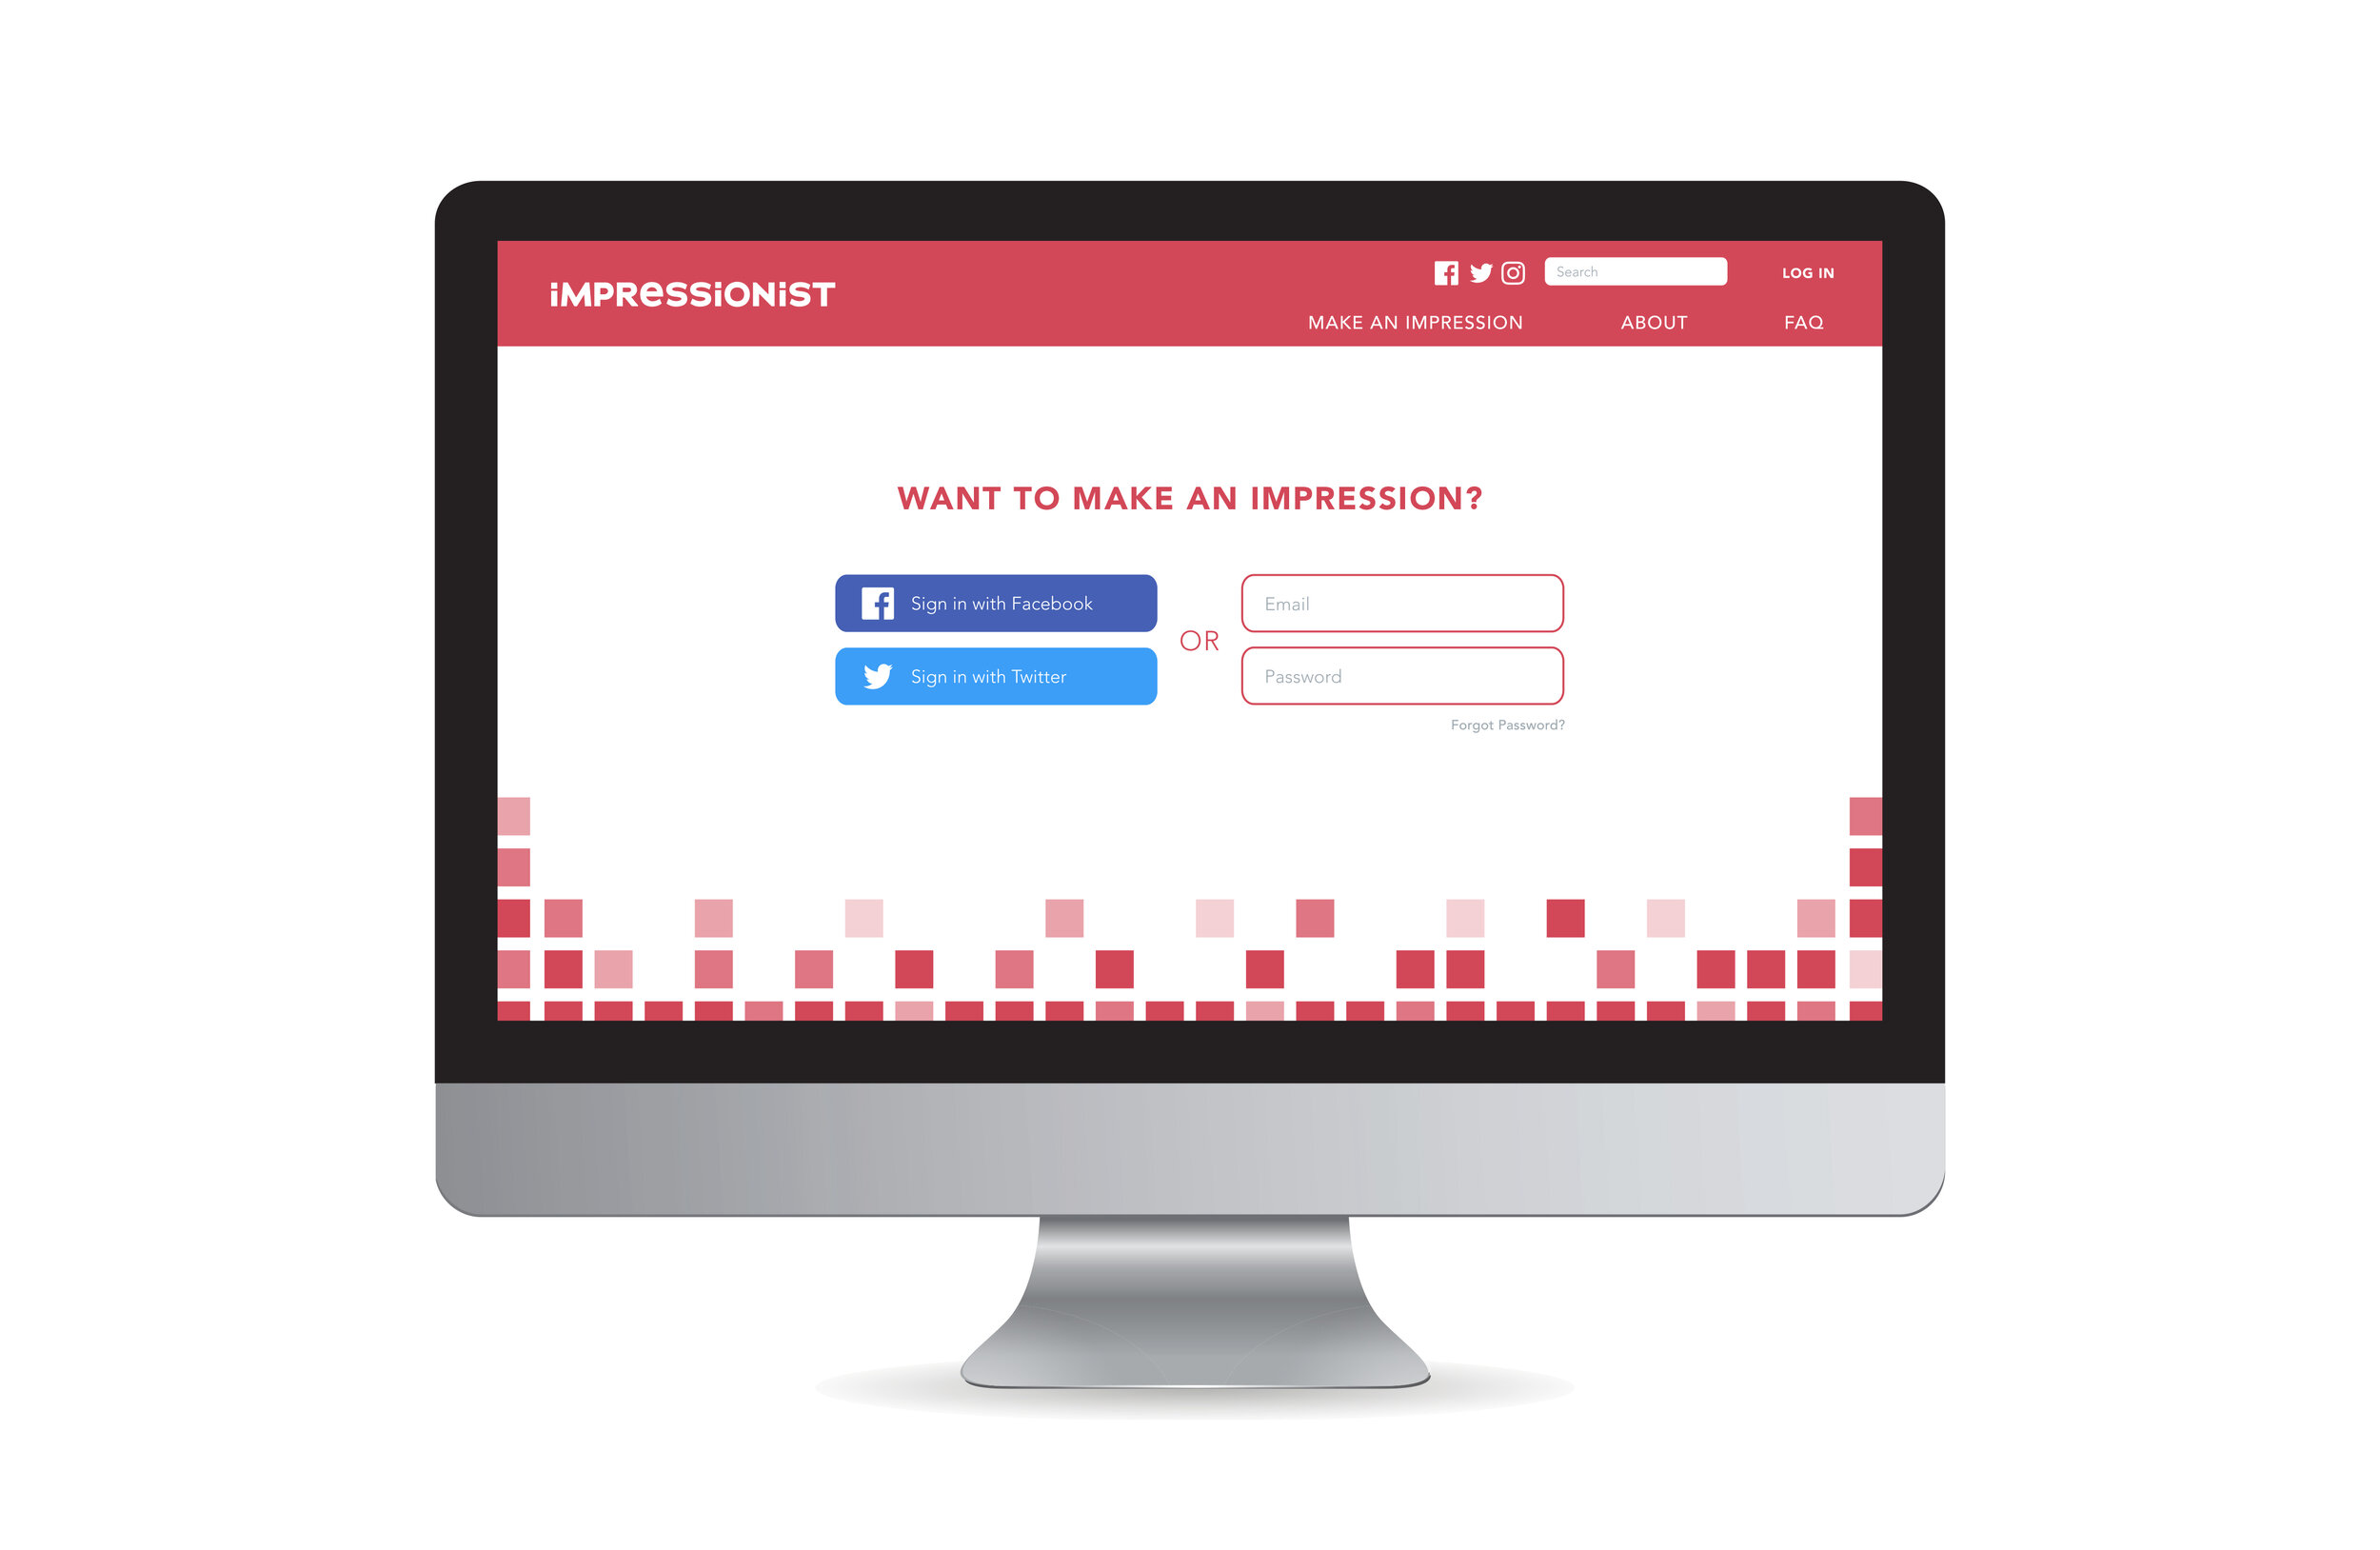
Tasked with selecting a data set and using it to create a digital visualization, I selected my work’s Facebook analytics and focused on the impressions. I created a heatmap on a calendar that visually showed the number of impressions on a given day. This allowed the team to see the data from weeks, months, or the whole year at once. With this visualization, I created a container called Impressionist, which would act as a desktop application linking to the data set and generating the visual for the user.